- Messages
- 8,392
- Reaction score
- 9,462
- Points
- 573
Yup. After you get your certificate, they show another sheet which contains the component grades.Nope they directly give the result sheet
🚀 NEW from the xtremepape.rs team: AI exam prep — 150,000+ worked solutions, and it marks your handwritten working from a photo. Sign in with your forum account & try it free → prepare.xtremepape.rs
Yup. After you get your certificate, they show another sheet which contains the component grades.Nope they directly give the result sheet
Yup. After you get your certificate, they show another sheet which contains the component grades.
7 out of 12.I have p4 for marking also, I'll be glad if someone would guide again
Marks :12View attachment 43687 View attachment 43688 View attachment 43689
Thankyouu!7 out of 12.
Here's a tip, let me write the starting for you.
The basic economic problem is that the wants of human beings are unlimited whereas the economic resources are limited. In order to fulfil the wants, a rational consumer allocates his income in a way as to achieve maximum satisfaction. In economics, this satisfaction can be measured by two approaches;
1) Classical approach
2) Modern approach
The utility, as mentioned in the question is the part of classical approach. The term 'utility' refers to 'satisfaction' gained by the consumer when he consumes a good. One draw back of this approach is that the utility is subjective; That is, it cannot be accurately measured and might be different according to every other individual. However the fact that the utility gained from consumption of one extra until is known as marginal utility where marginal refers to 'an extra' until being consumed.
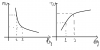
To study the utility, a law is applied known as law of diminishing marginal utility. This law states that with every successive consumption of a good, the marginal utility decreases. For example, Jane drinks 3 cups of water before going to work. When she drinks 1st cup of water, verily her utility is maximum. But as she proceeds to the 2nd cup, the marginal utility falls even though total utility increases. When she finally drinks the 3rd cup, the marginal utility further falls because the value of the water decreases as her need starts to fulfil.
Diagramatically, this can be show as
View attachment 43693
Therefore one very significant observation regarding this laws' relativity according to the real world is the fact that this law is only applied to necessities and not luxury goods or addictions as stated by Adam smith in this theory of Paradox of value.
Now you can tell about paradox of value and further use marginal utility graph to show how we derive a demand curve from it.

Owh and yes, so I will start the essay like you did, and put your diagram and continue according to my essay right? Aand is my diagram correct to put? And yea do I have to add anything more apart from what I have written? Thanks a lot!7 out of 12.
Here's a tip, let me write the starting for you.
The basic economic problem is that the wants of human beings are unlimited whereas the economic resources are limited. In order to fulfil the wants, a rational consumer allocates his income in a way as to achieve maximum satisfaction. In economics, this satisfaction can be measured by two approaches;
1) Classical approach
2) Modern approach
The utility, as mentioned in the question is the part of classical approach. The term 'utility' refers to 'satisfaction' gained by the consumer when he consumes a good. One draw back of this approach is that the utility is subjective; That is, it cannot be accurately measured and might be different according to every other individual. However the fact that the utility gained from consumption of one extra until is known as marginal utility where marginal refers to 'an extra' until being consumed.
To study the utility, a law is applied known as law of diminishing marginal utility. This law states that with every successive consumption of a good, the marginal utility decreases. For example, Jane drinks 3 cups of water before going to work. When she drinks 1st cup of water, verily her utility is maximum. But as she proceeds to the 2nd cup, the marginal utility falls even though total utility increases. When she finally drinks the 3rd cup, the marginal utility further falls because the value of the water decreases as her need starts to fulfil.
Diagramatically, this can be show as
View attachment 43693
Therefore one very significant observation regarding this laws' relativity according to the real world is the fact that this law is only applied to necessities and not luxury goods or addictions as stated by Adam smith in this theory of Paradox of value.
Now you can tell about paradox of value and further use marginal utility graph to show how we derive a demand curve from it.
Yup, the diagrams you used are correct but label them properly.Owh and yes, so I will start the essay like you did, and put your diagram and continue according to my essay right? Aand is my diagram correct to put? And yea do I have to add anything more apart from what I have written? Thanks a lot!
No problem.
🚀 NEW from the xtremepape.rs team: AI exam prep — 150,000+ worked solutions, and it marks your handwritten working from a photo. Sign in with your forum account & try it free → prepare.xtremepape.rs