- Messages
- 1,442
- Reaction score
- 7,812
- Points
- 523
Guyz help me with the M1,Specially with the General motion in a straight line and forces?
🚀 NEW from the xtremepape.rs team: AI exam prep — 150,000+ worked solutions, and it marks your handwritten working from a photo. Sign in with your forum account & try it free → prepare.xtremepape.rs
For the first parthttp://papers.xtremepapers.com/CIE/Cambridge International A and AS Level/Mathematics (9709)/9709_s12_qp_42.pdf
Can anyone solve the question 7 for me and also the graph?
I have done this tooFor the first part
The question tells you that there is a force of 12 N acting on the block and becuase it's a frictional force,it acts towards the right.
So this is the only force acting on the object and you know that F=ma and since a is 0.15 the acceleration -0.8
From this you know that U=3 t=2 and a =-0.8
then you can calculate V which gives you a vaalue of 1.4
So now you know that the block loses 7.2 Joules of energy so find the Kinetic energy loss at Y subtract this from 0.072 and find the value of V when it leaves.
I think you shold be able to go on from here>
Hope you understand
Good luck
I have done this too
but what about the graph....
Please help
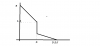
For part one my graph looked something like this with V on the y axis and T on the x axisI have done this too
but what about the graph....
Please help
ThanksFor part one my graph looked something like this with V on the y axis and T on the x axis

For part one my graph looked something like this with V on the y axis and T on the x axis
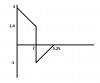
I THINK YOU R RIGHT DUDE?I think ur graph is wrong, because after collision the motion is towards a direction opposite to the initial motion. therefore, the velocity becomes negative, i think the graph shud be this:


POTENTIAL ENERGY =mghcan someone pleas tell me what is the work energy equation
and how does it link p.e, k.e, work done against resistance and work done by driving force
the one which is given by above post by qffdhrubacan sm1 help with q7 last part how to draw distance time graph http://papers.xtremepapers.com/CIE/Cambridge International A and AS Level/Mathematics (9709)/9709_s12_qp_42.pdf urgent help needed

the one which is given by above post by qffdhruba

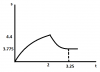
Why does it curve downwards after t=2 ?I think this is the displacement-time graph....

Why does it curve downwards after t=2 ?

🚀 NEW from the xtremepape.rs team: AI exam prep — 150,000+ worked solutions, and it marks your handwritten working from a photo. Sign in with your forum account & try it free → prepare.xtremepape.rs