-
Prepare by Xtremepapers!
🚀 NEW from the xtremepape.rs team: AI exam prep — 150,000+ worked solutions, and it marks your handwritten working from a photo. Sign in with your forum account & try it free → prepare.xtremepape.rs
You are using an out of date browser. It may not display this or other websites correctly.
You should upgrade or use an alternative browser.
You should upgrade or use an alternative browser.
physics A2 paper 5
- Thread starter Yara R.L
- Start date

- Messages
- 567
- Reaction score
- 553
- Points
- 103
That's easyI really do need someone to explain how we can get the worst acceptable line because i cant seem to understand how its done.
Thank you
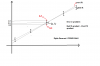
First of all make the line of best fit and the error bars as well
Then for worst acceptable line join the top of the last error bar with the bottom of the first error bar
Hope u get it otherwise feel free to ask again will try to clarify
Thank you so much but how do you get the error bars?That's easy
First of all make the line of best fit and the error bars as well
Then for worst acceptable line join the top of the last error bar with the bottom of the first error bar
Hope u get it otherwise feel free to ask again will try to clarify

- Messages
- 567
- Reaction score
- 553
- Points
- 103
I don't remember it at the moment I will ask someone and tell u afterwardsThank you so much but how do you get the error bars?

- Messages
- 124
- Reaction score
- 346
- Points
- 73
Thank you so much but how do you get the error bars?
Say if they tell you a certain reading is 0.5 with error +/- 0.2, you'll make three points on your graph. one is 0.5 obviously, then 0.7 ( 0.5+0.2=0.7)I don't remember it at the moment I will ask someone and tell u afterwards
and one at 0.3 (0.5-0.2=0.3). These three points make your error bar.
p.s. the pic attached doesn't belong to me. I downloaded it from another thread on this forum.
Attachments
Thank you so much! you literally just saved my paper 5!Say if they tell you a certain reading is 0.5 with error +/- 0.2, you'll make three points on your graph. one is 0.5 obviously, then 0.7 ( 0.5+0.2=0.7)
and one at 0.3 (0.5-0.2=0.3). These three points make your error bar.
p.s. the pic attached doesn't belong to me. I downloaded it from another thread on this forum.
Thank you so much! you literally just saved my paper 5!Say if they tell you a certain reading is 0.5 with error +/- 0.2, you'll make three points on your graph. one is 0.5 obviously, then 0.7 ( 0.5+0.2=0.7)
and one at 0.3 (0.5-0.2=0.3). These three points make your error bar.
p.s. the pic attached doesn't belong to me. I downloaded it from another thread on this forum.