- Messages
- 142
- Reaction score
- 131
- Points
- 43
Yes you canI just want to erase my doubt that can I use an answer like this (12±2) x 10^2 ? for gradient I meant
🚀 NEW from the xtremepape.rs team: AI exam prep — 120,000+ worked solutions, and it marks your handwritten working from a photo. Sign in with your forum account & try it free → prepare.xtremepape.rs
Yes you canI just want to erase my doubt that can I use an answer like this (12±2) x 10^2 ? for gradient I meant
Yeah it gives the sameUsually use that formula for functions like log or ln. But try it and see if you get the same answer, then it's no prob
") ) Great !
) Great !it is the difference between the (gradient of the BFL) and the (gradient of WAL).....Can anyone please help me out in Q2.c.iii ?
I have found the gradient, which is 0.56. But I am having difficulties in finding the errors of the gradient.
The absolute errors that I've got on the table are: 0.13, 0.08, 0.06, 0.04, 0.04 and 0.03.
Please help me how to find the gradient errors!!!
And also Q2d!!!
PLEASE!
http://papers.xtremepapers.com/CIE/Cambridge International A and AS Level/Physics (9702)/9702_s07_qp_5.pdf
I don't understandit is the difference between the (gradient of the BFL) and the (gradient of WAL).....
do u knw how to draw a worst acceptable line?..I don't understand
Oh okay! Thanks so much!do u knw how to draw a worst acceptable line?..
if so, find the gradient of that {Worst Acceptable Line} and gradient of the [Best Fit Line]...
then the error would be the difference between the those two values...
Oh and could you please help me with another thing?do u knw how to draw a worst acceptable line?..
if so, find the gradient of that {Worst Acceptable Line} and gradient of the [Best Fit Line]...
then the error would be the difference between the those two values...
Im sorry bt im also a bit confused with the absolute uncertainty thing....il let u knw as soon as i find out...Oh and could you please help me with another thing?
How do I find the absolute uncertainties in the table?
And can you please also help me in Q2d in this paper: http://papers.xtremepapers.com/CIE/Cambridge International A and AS Level/Physics (9702)/9702_s07_qp_5.pdf
i did bad in my physics paper 42 too . but not that bad. will proly get around 53 or sumthin. i got only one xam left now which is Physics PAper 52 @ 30th May 2012. if i score like 21 out of 30 in it . can i get an A in physix ??? i got A(82%) in my AS level . plz sum1 lemme know if i can score an overall A in Physix . tnx .
here's a revision note for 9702 physics paper
Question 1:
first be able to reduce the equation in the simplest form ..i.e y=mX=c ..and recognize the gradient
calculate the data in 3 s.f(generally done) or to one s.f more or equal to the s.f of the raw data
in case of logarithmic calculations, the number of d.p is the number of s.f ..hence for a raw data of 3 s.f the log should be calculated to 3 or 4 d.p
to calculate absolute uncertainty the most accepted method is to calculate the maximum difference and divide by 2 ..sf of uncertainty is usually ignored in the mark scheme but stick to 1 or 2 s.f
plot all the six points,a small encircled dot is acceptable use sharp pencil to plot , and draw the error bars. all to nearest half square on the grid.
(u can also analyze from the graph as how much s.f to use..as the graphs interval's points's tenth division place is to be plotted )
the gradient should be calculated by drawing a triangle and mentioning the points of the vertices in the best-fit line ..the hypotenuse should be greater than halt the length of the best-fit line.
working should be shown clearly
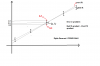
and the worst-fit line is drawn by joining the top of the topmost point's error bar and the bottom of the bottommost error bar..and the line should touch every error bar.
both line should be clearly LABELLED ,and the gradient of worst-fit is calculated in similar way to best-fit ..calculate it on the blank page at the end..and just show the gradient value in working area while calculating the uncertainty in gradient..
the error in gradient is gradient of best fit - gradient of worst fit ,or 1/2 * (steepest line's gradient - shallowest line's gradient)
all calculation to 3 s.f
and for calculations , which is usually related to the calculated gradient, take care of units, power of tens and to calculate the percentage uncertainty work out the value with the gradient and again with the error+the gradient and work out the difference which is the absolute uncertainty , hence calculate the percentage uncertainty .(working is only credited here and calculations are not checked)
Question 2:
state the basic statement, it is awarded 1 mark..such as change pressure and measure power..and repeat(o/n 05)
Draw a diagram with all the equipment you might use during the experimentation of this plan..a basic, well labelled diagram could score many marks; even if the explanation is weak.
identify the control variable
make sure you know the working of some equipments as:
collimator,sonometer, strobe, bourdon gauge, joule meter,thermometers,light-spot galvanometer needle valve, vacuum grease , lightgate, smart pulley ,balance,newton meter,ticker tape data-loggers , optical bench, set squares etc.. don't panic of you don't but u should know what equipment to use to measure something.
make sure u understand the question and collect all the method marks by suggesting means of measuring the quantities u might measure during the experiment.
there are 5 method marks to be scored.
now beware of safety measures. like earmuffs eardrums, goggles , safety screens . sand bucket for falling masses..etc
now be able to point some additional details they are worth 4 marks.
these can also be awarded on a detailed diagram..
suggest the possible ranges of devices, suggest some ways of sophisticating the experiment..but donot make vague references and do not forget why are u performing this experiment .
Best of luck . :Yahoo!: bineetojha
Ya, I also need help in drawing error bars and then using to draw line of worst fit
when u have found out the error like 0.5 +/- 0.2 then u plot 0.5 first and a line joining it to the point 0.2 units ABOVE 0.5 and 0.2 units BELOW 0.5, so u join three points 0.5, 0.7 and 0.3 with ure encircled point at 0.5....U dig ?....can someone please explain to me how to draw error bars.....please.....
when u have found out the error like 0.5 +/- 0.2 then u plot 0.5 first and a line joining it to the point 0.2 units ABOVE 0.5 and 0.2 units BELOW 0.5, so u join three points 0.5, 0.7 and 0.3 with ure encircled point at 0.5....U dig ?....
....if u dont mind cn u help me with [papers.xtremepapers.com/CIE/Cambridge%20International%20A%20and%20AS%20Level/Physics%20(9702)/9702_s11_qp_51.pdf] question 2 part b uncertainities ]🚀 NEW from the xtremepape.rs team: AI exam prep — 120,000+ worked solutions, and it marks your handwritten working from a photo. Sign in with your forum account & try it free → prepare.xtremepape.rs