- Messages
- 500
- Reaction score
- 425
- Points
- 73
How is the pump attached to the apparatus?Thanks
A pump should also be placed to vary pressure
We are currently struggling to cover the operational costs of Xtremepapers, as a result we might have to shut this website down. Please donate if we have helped you and help make a difference in other students' lives!
Click here to Donate Now (View Announcement)
How is the pump attached to the apparatus?Thanks
A pump should also be placed to vary pressure
Instead of adding the tube to a manometer you add it to a pump and a pressure gauge.How is the pump attached to the apparatus?
Thank youInstead of adding the tube to a manometer you add it to a pump and a pressure gauge.
I think it's not important to show the pump specifically, we can just show a tube and write 'to pump' and yes a pressure guage instead of the manometer which will be shown as a circle and labelled. Manometer will also work but then we need to explain it in detail that how value for pressure will be obtainedHow is the pump attached to the apparatus?
Thank you for your help.I think it's not important to show the pump specifically, we can just show a tube and write 'to pump' and yes a pressure guage instead of the manometer which will be shown as a circle and labelled. Manometer will also work but then we need to explain it in detail that how value for pressure will be obtained
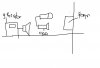
Loudspeaker connected to signal generator and microphone connected to CRO placed infront of the wall. That's about it. Did a free hand drawing so hopefully you get an idea of what it looks like.If anyone has drawn diagram for this, plz share
And plz tell me how will the intensity be calculated from the amplitude. Amplitude² is proportional to intensity but how will the value be calculated as we don't know of any constant in this equation.Loudspeaker connected to signal generator and microphone connected to CRO placed infront of the wall. That's about it. Did a free hand drawing so hopefully you get an idea of what it looks like.
") Don't we need to give any electricity supply to the microphone?
Don't we need to give any electricity supply to the microphone?Yes we would use the relation for intensity and amplitude(intensity is directly proportional to amplitude squared). You need not explain how to calculate k(intensity in terms of k should be fine).And plz tell me how will the intensity be calculated from the amplitude. Amplitude² is proportional to intensity but how will the value be calculated as we don't know of any constant in this equation.
P.s should't the microphone be placed beside the speaker with a barrier in between? And to measure the amplitude of incident wave a cro should also be connected to speaker. Is it so?
This one may sound silly but that's okay
Ok thank u so much! Just a little thing, we need the intensity of sound wave before reflection as well as mentioned in the formula so I think that needs to be measured as wellYes we would use the relation for intensity and amplitude(intensity is directly proportional to amplitude squared). You need not explain how to calculate k(intensity in terms of k should be fine).
Yes the microphone will be placed besides the speaker but in a side-view diagram, that is impossible to show hence I have shown them infront of each other.
You are measuring the amplitude of the wave that get reflected from the wall and foam, so you would connect CRO to microphone, not the speaker.
Yes we need to give a supply to the microphone but that's not really important to the question here - it would be a waste of space on the diagram and would make the diagram messy. You could mention it in the space below.
You are talking about I₀ here? it would be the incident wave, ie the wave produced by the speaker not the one reflected by the wallYes, that would be determined by removing the foam and measuring the intensity of reflected wave with wall only.
Oh yeah alright. Didn't read the question properly. Yeah Io would be the intensity of wave with no reflection so in that case you would place the microphone really close to speaker and facing it and measure the intensity.You are talking about I₀ here? it would be the incident wave, ie the wave produced by the speaker not the one reflected by the wall
It varied depending on the values of t for example one set of values were 9.0 and 9.8s. Here the period would be 9.4/20 but the uncertainty would be ( (9.8/20)-9/20)/2 - basically the max and min value method of finding uncertainty: max value-min value/2What was the error in T?
What variant is this?It varied depending on the values of t for example one set of values were 9.0 and 9.8s. Here the period would be 9.4/20 but the uncertainty would be ( (9.8/20)-9/20)/2 - basically the max and min value method of finding uncertainty: max value-min value/2
Variant 2What variant is this?
Yes it was...Did anyone do variant 1 (51)? The paper was really easy.
So if you do by this method, the mean time is 9.4±0.1s so isn't max value 9.41 and min 9.39? Error in T will then be 0.005It varied depending on the values of t for example one set of values were 9.0 and 9.8s. Here the period would be 9.4/20 but the uncertainty would be ( (9.8/20)-9/20)/2 - basically the max and min value method of finding uncertainty: max value-min value/2
What? Mean time would be 9.4s but with an uncertainty of 0.4s. Mean period would be 0.47 with an uncertainty of 0.02s.So if you do by this method, the mean time is 9.4±0.1s so isn't max value 9.41 and min 9.39? Error in T will then be 0.005
And if we apply the other rule that if a quantity is being multiplied or divided by a number, then the error in the calculated quantity is error in previous quantity times the number. In this case it would have been 0.1/20 = 0.005 for all values of T
Oh we can't use the multiplied or divided rule in this because the calculations only involved one variable that had one uncertainty. So we had to use max-min values/2 - really the only method.And if we apply the other rule that if a quantity is being multiplied or divided by a number, then the error in the calculated quantity is error in previous quantity times the number. In this case it would have been 0.1/20 = 0.005 for all values of T
For more than 16 years, the site XtremePapers has been trying very hard to serve its users.
However, we are now struggling to cover its operational costs due to unforeseen circumstances. If we helped you in any way, kindly contribute and be the part of this effort. No act of kindness, no matter how small, is ever wasted.
Click here to Donate Now