- Messages
- 433
- Reaction score
- 237
- Points
- 53
which ppr??
Can you please help me with this? https://www.xtremepapers.com/community/attachments/23499/
We are currently struggling to cover the operational costs of Xtremepapers, as a result we might have to shut this website down. Please donate if we have helped you and help make a difference in other students' lives!
Click here to Donate Now (View Announcement)
which ppr??
Can you please help me with this? https://www.xtremepapers.com/community/attachments/23499/
")
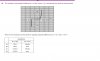
The answer is A my friendVelocity is the gradient of the acceleration-time graph. Following that, the graph C seems the viable option. If you look closely, toh the gradient of a-t graph increases from a horizontal slope, decreases and reaches back a 0 gradient at its maximum point. That is what the graph C shows!
Concentrate a little and you'll surely understand!
Can you please help me with this? https://www.xtremepapers.com/community/attachments/23499/
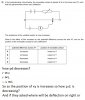
I'm mess up with this portionj too : Waves especially phase difference :/http://papers.xtremepapers.com/CIE/Cambridge International A and AS Level/Physics (9702)/9702_w10_qp_23.pdf
Please help me with qn no. 6(b)(ii).. I'm totally confused!
Thans
Velocity is the gradient of the acceleration-time graph. Following that, the graph C seems the viable option. If you look closely, toh the gradient of a-t graph increases from a horizontal slope, decreases and reaches back a 0 gradient at its maximum point. That is what the graph C shows!
Concentrate a little and you'll surely understand!
The answer is A my friend
A way to look at this question is by looking at the end of the graph . when acceleration is zero it doesnt mean velocity is zero so B & C arent correct . and D isnt correct as it only shows acceleration increasing n no decrease . So A has to be the ans
The uncertainty in g is simply obtained by adding the uncertainties of s and t.
A way to look at this question is by looking at the end of the graph . when acceleration is zero it doesnt mean velocity is zero so B & C arent correct . and D isnt correct as it only shows acceleration increasing n no decrease . So A has to be the ans
Thankusince g is inversely proportional to r^2
when r = R, g = 1.oo g
r = 2R, g = 0.25g
r = 3R, g = 0.11g
r = 4R, g = 0.0625g
plot the points n voila....ur graph is made!!
http://papers.xtremepapers.com/CIE/Cambridge International A and AS Level/Physics (9702)/9702_w09_qp_42.pdf
Q11 part b (ii)
why is the frequency 10 kHz?
0 or 180 i.e. both waves are in phase, as their is no lagging or proceeding in both waves!I'm mess up with this portionj too : Waves especially phase difference :/
For more than 16 years, the site XtremePapers has been trying very hard to serve its users.
However, we are now struggling to cover its operational costs due to unforeseen circumstances. If we helped you in any way, kindly contribute and be the part of this effort. No act of kindness, no matter how small, is ever wasted.
Click here to Donate Now