- Messages
- 243
- Reaction score
- 198
- Points
- 43
http://papers.xtremepapers.com/CIE/Cambridge International A and AS Level/Mathematics (9709)/9709_w10_qp_63.pdf
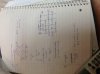
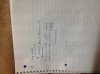
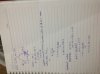
please help me with 6(iii), permutation, stuck with it for an hr already still cant seem to solve it
Mrs Brown = 3 *C *1 Mrs Lin = 10 *C*1 Student = 5*C*1
Prob= (3*10*5*11P9)/(4.36*10^6)
Ans = 0.0687
NB: I m nt sure abt ans
Btwn ppl in this thread pls help each other …
")