
Thought blocker
XPRS Moderator
- Messages
- 8,558
- Reaction score
- 34,876
- Points
- 718
Sorry for the delay.
🚀 NEW from the xtremepape.rs team: AI exam prep — 150,000+ worked solutions, and it marks your handwritten working from a photo. Sign in with your forum account & try it free → prepare.xtremepape.rs
Sorry for the delay.

thanks a lotSorry for the delay.
View attachment 44799

Got a quick question. How many significant figures should a percentage uncertainty have? (in paper 3, practical)
If I have an absolute uncertainty of 0.1 cm and the reading is 2.5 cm, how many significant figures should the percentage uncertainty have?
Got a quick question. How many significant figures should a percentage uncertainty have? (in paper 3, practical)
If I have an absolute uncertainty of 0.1 cm and the reading is 2.5 cm, how many significant figures should the percentage uncertainty have?
Got a quick question. How many significant figures should a percentage uncertainty have? (in paper 3, practical)
If I have an absolute uncertainty of 0.1 cm and the reading is 2.5 cm, how many significant figures should the percentage uncertainty have?

I have a question regarding paper 3. When drawing a graph based on the readings on our table, if one of our points is far off from the others, after circling it, should we repeat for the reading by crossing out our previous results on the table and just write the new results above the previous one? Or add a new row? Or do we not repeat at all?
 The one I posted above.
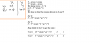
Yeah, did it the same way..Use the equation of motion s = ut + 0.5at^2
Now substitute the data into the equation
For XY
S= 40
t=12
u=??
a=??
equation 1 : 40 = 12u + 72a
For the X to Z
S= 80
t= 18
a=??
u=???
equation 2 : 80 = 18u + 162a
Why not I use the distance Y to Z is that it unitial velocity is different from that of X to Y
Now use simultaneus equation to get the answer..
🚀 NEW from the xtremepape.rs team: AI exam prep — 150,000+ worked solutions, and it marks your handwritten working from a photo. Sign in with your forum account & try it free → prepare.xtremepape.rs