- Messages
- 958
- Reaction score
- 3,499
- Points
- 253
We are currently struggling to cover the operational costs of Xtremepapers, as a result we might have to shut this website down. Please donate if we have helped you and help make a difference in other students' lives!
Click here to Donate Now (View Announcement)
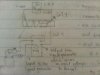
sorry you're seeing a reply after so long! Anyway i cant post a pic,but the basics of the diagram are what is shown in the question,plus:
-a meter rule placed vertically "behind" the wire,to measure distance
-micrometer to measure diameter of wire
-rheostat in circuit to keep current constant
and ammeter in current
thats it!
hope i helped!
")
thats decent and nice diagram bro ... thanks for it ....
Quantity doesnt matter if u feel u need to do more u can but i dont think its time to try new things bcoz paper is tomorrow so go through all the ones u have done and u will do great.are we suppose to do such old p.papers? i did from 2007 to 2012
No it's okay! No need to apologize
Thank you so much! I drew the same thing, except for the rheostat. I dont know how to draw a rheostat
Quantity doesnt matter if u feel u need to do more u can but i dont think its time to try new things bcoz paper is tomorrow so go through all the ones u have done and u will do great.
And 2007 to 2012 are enough i suppose
okthis is enough...but if u get time do look at planning excercise of old papers
Hey, i'm really sorry I couldn't post it earlier, I was kinda pressed for time on other matters.
Sorry if the diagram isn't good enough (It looks bad, but in this time, it's the best I could do - sorry!)
View attachment 28405
Good Luck for all your exams!
magnesium how to calculate %age uncertainity? abso/measure value*100?
can u tel me procedure and diagram of oct/nov10 p53 q1?
yes it is correct...uncertainity / value * 100
ok thaaanku god bless
v = s/t where s=distance, t=time
v^2 = (s/t)^2
so v^2 = (0.05/t)^2
then substitute values of time from each row into the eqn
eg for row 1, v^2 = (0.05/0.046)^2
so v^2 = 1.18
then uncertainty is (max value of v^2 - min value of v^2) / 2
so max value of v^2 = (0.051/minimum time)^2
min value of v^2 = (0.049/ max time ) ^2
subtract these two values and then divide by 2 to obtain uncertainty
Hope that helped
For more than 16 years, the site XtremePapers has been trying very hard to serve its users.
However, we are now struggling to cover its operational costs due to unforeseen circumstances. If we helped you in any way, kindly contribute and be the part of this effort. No act of kindness, no matter how small, is ever wasted.
Click here to Donate Now