- Messages
- 2
- Reaction score
- 0
- Points
- 1
Can anyone help me with continuity correction plz....i'm confused when to add or subtract those limits.....plz help.....giving As this 22nd
🚀 NEW from the xtremepape.rs team: AI exam prep — 120,000+ worked solutions, and it marks your handwritten working from a photo. Sign in with your forum account & try it free → prepare.xtremepape.rs
Can anyone help me with continuity correction plz....i'm confused when to add or subtract those limits.....plz help.....giving As this 22nd


Can anyone help me with continuity correction plz....i'm confused when to add or subtract those limits.....plz help.....giving As this 22nd
Yes, we have to use class boundaries or define these classes in terms of x<=khttp://papers.xtremepapers.com/CIE/Cambridge International A and AS Level/Mathematics (9709)/9709_s11_qp_62.pdf in question 5 i do we have to use class boundaries and in iii I don't get when do we have to subtract from the total can someone please hell me
But in the marking scheme the points used were (20.5,10)..Yes, we have to use class boundaries or define these classes in terms of x<=k
For example, 1-20 is x<=20 similarly 41-50 will be x<=50 and corresponding cumulative frequency will be written with each of them below and then graph will be drawn for example for x<=20 you have cf = 10 so you have one co-ordinate as (20,10). Now note one thing, the reason why are we not aligning the classes is because the random variable here is rooms and rooms are discrete you can't have 1.5 rooms right, so due to the random variable being discrete we do not align the classes by taking average. However if mean was asked then we have to do so. Second part of query : The questions when says above or over any number for example in this question over 30 rooms was asked so from graph you got days for rooms less than 30 so for more you have to subtract from total to get the upper part.
the intervals given already in the questionhttp://papers.xtremepapers.com/CIE/Cambridge International A and AS Level/Mathematics (9709)/9709_w11_qp_62.pdf in q4 iv what is the interval used
It is given in the question <20 doesn't mean from 0-19 since 20 is not includedthe intervals given already in the question
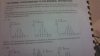
you find frequency by 0-0 20-0 50-20 100-50 160-100 210-160 220-210 u will have 0,20,30,50,60,50,10
and the class width is 20-0 30-20 40-30 45-40 50-45 60-50 70-60 you will have 20,10,10,5,5,10,10
Frequency Density= F/class width 0/20 20/10 30/10 50/5 60/5 50/10 10/10----> 9,2,3,10,12,5,1
what about 19.1 19.2 19.3... they are so you cant take 0-19It is given in the question <20 doesn't mean from 0-19 since 20 is not included
http://papers.xtremepapers.com/CIE/...S Level/Mathematics (9709)/9709_s11_qp_63.pdf what about in q 3 iiiwhat about 19.1 19.2 19.3... they are so you cant take 0-19
now you might ask what about 0-19.5 what about 19.6,19.7....
they have not asked you class width here have they?
But I need to have an interval from which I would obtain the midpoint to calculate the meanthey have not asked you class width here have they?
the one i answered was for class width here they just want marks which is x
But I need to have an interval from which I would obtain the midpoint to calculate the mean
 what i do is if there is > sigh
 The mark scheme also says ACCEPT (20,10) (40,42) etc and logically I cannot think of assigning a non discrete number to a discrete variableBut in the marking scheme the points used were (20.5,10)..
🚀 NEW from the xtremepape.rs team: AI exam prep — 120,000+ worked solutions, and it marks your handwritten working from a photo. Sign in with your forum account & try it free → prepare.xtremepape.rs