- Messages
- 1,436
- Reaction score
- 9,002
- Points
- 523
what u doing here ????????????// u dont take biology ??????How was the paper ?
🚀 NEW from the xtremepape.rs team: AI exam prep — 120,000+ worked solutions, and it marks your handwritten working from a photo. Sign in with your forum account & try it free → prepare.xtremepape.rs
what u doing here ????????????// u dont take biology ??????How was the paper ?
Asking na.what u doing here ????????????// u dont take biology ??????

I am a member of XPC, hence it was my duty to ask.yup i am asking ..................................
I am a member of XPC, hence it was my duty to ask.
ok
Plz anyone help me
I don't understand when difference is significant or not significant in both chi square test and t-test
I would b grateful for any help.
ThanksCheck in which direction the value of your critical value(For t-test) or x^2(For chi-squared test) proceeds, always check relative to probability 0.05 and by checking the degrees of freedom. If the probability increases (if it proceeds in the direction of increasing probability) then this means it has occurred by chance and is not significant, if the probability decreases, it means it is not due to chance and is significant. Hope this helps.
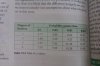
E.g. Follow the image attached.
If the x^2 value is 0.79 and degrees of freedom 3.
Check under 0.05 probability (Third row and second column). 0.79 value moves towards left as it is very much less than 7.82 and so the probability increases and this means it is just due to chance and not significant.
You can say that error bars are :Guys can someone explain the error bars to me?
Many ThanksYou can say that error bars are :
*the range at which the 'point' is likely to occur
*or uncertainty of the point
*the maximum and minimum values that the point can take
If the error bars of two sets of data overlap (i.e. they share one point or more), then the difference between the two sets is not significant.
If the error bars of two sets of date do not overlap, then there is a possibility (not certain!) that the difference between the two sets is significant.
Can some one plzz upload some notes for paper 5 ....
I am really finding it difficult to do the paper ...
i dont have notes but i found it really hard aswell so i went to my teacher today and asked her to explain. the paper is Planning, Analysis and Evaluation. Planning the experiment, analyzing the experiment by statistical tests and evaluating how well the experiment was done. When your asked about the Iv and DV remember DV is what you actually MEASURE, for example i kept making this mistake in photosynthesis question where they wanted to measure the rate of photosynthesis, by using DCICP which would indicate the rate of photosynthesis by turning from blue to colorless. When they asked for the DV i wrote 'rate of photosynthesis' but its actually the DCICP to turn from blue to colorless that was the DV because thats how we are actually MEASURING photosynthesis. Youll only get this by practice. second, the questions which ask you about how you would measure etc etc, you must include basically the Iv and DV, MENTION that in the question even if they dont ask you. how you would vary the Iv and how you would measure the DV, you have to mention how you would standardize and control variables, risk assessment etc. otherwise histograms, mean mode median, error bars, etc you need to know. get an understanding of the mechanism of the paper first, youll feel much more confident,
!!!I inboxed you itThanksss alot
Do you have an experiment list ..... like what type of experiment can come and how things go about...
could i get them as well, if it's no issue?I inboxed you it
🚀 NEW from the xtremepape.rs team: AI exam prep — 120,000+ worked solutions, and it marks your handwritten working from a photo. Sign in with your forum account & try it free → prepare.xtremepape.rs