- Messages
- 18
- Reaction score
- 31
- Points
- 3
okkkk, maybe you took the wrong end of the stick here. am sorry.Aaah! But don't you think I know that? You don't know my routine so how come you are already passing a comment? :|
🚀 NEW from the xtremepape.rs team: AI exam prep — 150,000+ worked solutions, and it marks your handwritten working from a photo. Sign in with your forum account & try it free → prepare.xtremepape.rs
okkkk, maybe you took the wrong end of the stick here. am sorry.Aaah! But don't you think I know that? You don't know my routine so how come you are already passing a comment? :|
Can you check its validity , it doesnt open with me !sitooon here i hop this helps this is all i can found
https://www.xtremepapers.com/community/threads/maths-notes-p1-p2-m1-m2-and-s1.9180/Can you check its validity , it doesnt open with me !
Thanks for you searching , but its not useful !
Here you go

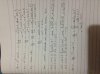
P(X = 0) = 1/10 (given)
remaining integers are 7 from the set and the probability is to be divided equally among them
so the probability of one of the remaining 7 integers = 1 - (1/10) divided by 7 = (9/10) / 7 = 9/70
i) P(X<2) = P(X = - 2) + P(X = - 1) + P(X = 0) + P(X=1)
= 9/70 + 9/70 + 1/10 + 9/70 = 0.486
ii) the probability distribution table looks like
x - 2 - 1 0 1 2 3 4 5
p(X=x) 9/70 9/70 1/10 9/70 9/70 9/70 9/70 9/70
now calculate the variance using the formula
E(X^2) - ((E(X))^2
iii) we are going from the negative of a positive number to its twice. so let's check the possibility of a number existing in negative which is - 2 or - 1
so now first possibility
let a be 1 so probabilities should be added from - 1 to 2(1) = 2
P(X=-1) + P(X=0) + P(X=1) + P(X=2)
= 9/70 + 1/10 + 9/70 + 9/70 = 17/35 (shown)[
hanks aloot can u help me in ths too http://papers.xtremepapers.com/CIE/...S Level/Mathematics (9709)/9709_s12_qp_63.pdf Q2 ii)P(X = 0) = 1/10 (given)
remaining integers are 7 from the set and the probability is to be divided equally among them
so the probability of one of the remaining 7 integers = 1 - (1/10) divided by 7 = (9/10) / 7 = 9/70
i) P(X<2) = P(X = - 2) + P(X = - 1) + P(X = 0) + P(X=1)
= 9/70 + 9/70 + 1/10 + 9/70 = 0.486
ii) the probability distribution table looks like
x - 2 - 1 0 1 2 3 4 5
p(X=x) 9/70 9/70 1/10 9/70 9/70 9/70 9/70 9/70
now calculate the variance using the formula
E(X^2) - ((E(X))^2
iii) we are going from the negative of a positive number to its twice. so let's check the possibility of a number existing in negative which is - 2 or - 1
so now first possibility
let a be 1 so probabilities should be added from - 1 to 2(1) = 2
P(X=-1) + P(X=0) + P(X=1) + P(X=2)
= 9/70 + 1/10 + 9/70 + 9/70 = 17/35 (shown)
Whats the meaning of ( EE/KE/PE balance ) in M2 ???
M2!!so cool!!!Whats the meaning of ( EE/KE/PE balance ) in M2 ???
I didnt get you >?M2!!so cool!!!
🚀 NEW from the xtremepape.rs team: AI exam prep — 150,000+ worked solutions, and it marks your handwritten working from a photo. Sign in with your forum account & try it free → prepare.xtremepape.rs