- Messages
- 4,609
- Reaction score
- 3,903
- Points
- 323
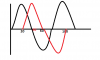
i)Amplitude is 7.6mm which you can see it from the graph (the highest displacement)
ii) 180 (This is 180 because, one graph is completed in 80cm.....So in 80cm 360 degree is completed. So there is a phase difference of 40cm between the point. So it is half of 80com and hence it is half of 360, which is 180.......Or you could use this formula- (40/80)*360 which is the normal formula of phase difference)
iii) V=frequency * wavelength
= 15 * 0.8
=12
(b) This one i have to show you by drawing....if you are interested then i can show you
(c)
i. Zero (Since they are on the same wave and phase)
(ii)
Antinode- A region in which two amplitude are at its highest point in opposite direction
Node- A region where two waves intersect and have no displacement
(iv) Again, i have to draw this...if you are interested then i could give a separate PDF for this by drawing in computer
Yep. i also want the graphs

thanks alot