- Messages
- 398
- Reaction score
- 685
- Points
- 103
I did that's the right answer. Was just wondering if pendulum would also work. Probably not since my answer's not in the mark scheme. Thanks
You are welcome
🚀 NEW from the xtremepape.rs team: AI exam prep — 120,000+ worked solutions, and it marks your handwritten working from a photo. Sign in with your forum account & try it free → prepare.xtremepape.rs
I did that's the right answer. Was just wondering if pendulum would also work. Probably not since my answer's not in the mark scheme. Thanks
Just yout t/s squared so if t/s is 0.95 then t^2/s^2 = 0.95^2 = 0.9025and how to calculate paper 6 oct/nov 2009 question 1(ii) the t2/s2 question?
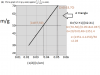
this is called the triangle ans 3(c) you do 0.3*0.5=0.15http://papers.xtremepapers.com/CIE/Cambridge IGCSE/Physics (0625)/0625_w10_qp_61.pdf
Q 1 C ,, I got a straight line in the graph so i can find the gradient by Y2-Y1/X2-X1 , but why in ms they say show a triangle ?
Q 1 D : what is the value of G ? and how ?
Q 3 C : whats the answer and explain please ?
+ Can I have a tip in choosing the scale of a graph when having decimals valus ?
Thanks in Advance !
Just yout t/s squared so if t/s is 0.95 then t^2/s^2 = 0.95^2 = 0.9025
0.9025 to 3 significant figures is 0.903 which is the answer in the marking scheme
how to plot values like 0.903 on graph?this would be really close to 0.9 and it won't matter if it is slightly left or right because Ms has a +-0.1 you see!ive got so many doubts
It's ok lets tackle these doubts one by one. T/s is a twentieth of t/s. You see, t/s is the time for 20 oscillations. T/s is the time for 1 oscillation. So just divide t/s by 20. Now to plot it, your graph must scale from 0.6 to 1 (range in which T^2 occurs) . There are 10 divisions. So you can make the bottom division 0.5 and the top division 1. Now each division represents 0.5. This makes it easier to plot 0.903 if you cannot plot it just try to plot the point closest to it.ive got so many doubts
It's ok lets tackle these doubts one by one. T/s is a twentieth of t/s. You see, t/s is the time for 20 oscillations. T/s is the time for 1 oscillation. So just divide t/s by 20. Now to plot it, your graph must scale from 0.6 to 1 (range in which T^2 occurs) . There are 10 divisions. So you can make the bottom division 0.5 and the top division 1. Now each division represents 0.5. This makes it easier to plot 0.903 if you cannot plot it just try to plot the point closest to it.
this would be really close to 0.9 and it won't matter if it is slightly left or right because Ms has a +-0.1 you see!
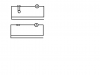
One resistor is on AB the other is on CD. These resistors represent the resistance of the wires AB and CD. When drawing circuit diagrams the wires in them are assumed to be perfect conductors. The wires AB and CD have a certain resistance that's why on the circuit diagram you represent that resistance with resistorshttp://papers.xtremepapers.com/CIE/Cambridge IGCSE/Physics (0625)/0625_w08_qp_6.pdf
Question 2 i know how to place the voltmeter and ammeter but where in the world should i keep the resistor
how do i complete this?
what about S is it connected to the resistor? And thanksOne resistor is on AB the other is on CD. These resistors represent the resistance of the wires AB and CD. When drawing circuit diagrams the wires in them are assumed to be perfect conductors. The wires AB and CD have a certain resistance that's why on the circuit diagram you represent that resistance with resistors
ruler if they don't mentionHi everyone. If they don't specify, should we join points on graph using ruler or free hand?
Npwhat about S is it connected to the resistor? And thanks
When S is connected it'll be after the resistor. You want to know the potential before the resistor and the potential after. Although I'm not so sure about the voltmeter. Here's what the examiners report says "Many candidates found it difficult to score full marks here. Most candidates knew the circuit symbols but did not score the mark for a correct arrangement. It seemed that many had been trained using past papers and assumed, without proper consideration, that this would be the same as previous circuits they had seen. Therefore, many connected the voltmeter across the power source."Unless it's an obvious curve (typically for temperature). Then you cannot use a ruler.ruler if they don't mention
couldnt get 3 Cthis is called the triangle ans 3(c) you do 0.3*0.5=0.15
go to the table find where is 0.15 and its resistance is 10 ohms
That's exactly what you're supposed to do. If suppose a graph has 5 divisions and the values range from 50 to 100. Then you start with 50 instead of 0can i do a graph like this 40,50,60 .... without adding 0,10,20,30???
actually the graph should be 0,10,20,30,40 but it won't fit so what do i do if i take 0,20 that makes the graph not fit more than the half as they say it should be more what should i do?
🚀 NEW from the xtremepape.rs team: AI exam prep — 120,000+ worked solutions, and it marks your handwritten working from a photo. Sign in with your forum account & try it free → prepare.xtremepape.rs